Inclusivity Index Themes
Questions and Objectives
Is the feedback on qualities, that relate to and/or reinforce each other, consistent?
Do inconsistencies imply a lack of depth or a thorough embrace of our potential?
Eliminate all negative relationships between qualities.
How do faculty perceptions of the school align with the students’ realities?
Bring all differences between faculty and student quality scores to within the agreement range.
Consistency and alignment across the results, for both students and faculty, are necessary objectives. At a deeper level, these Inclusivity Index qualities interact, meaning we can gain insight when pairing student responses for one quality with a related quality. As an example, consider the qualities sense of belonging and kindness. How do we view a student who scores the survey low on sense of belonging but high on kindness? The same thought could apply to trauma and academic or social support, or perhaps social identity acceptance and social identity awareness.
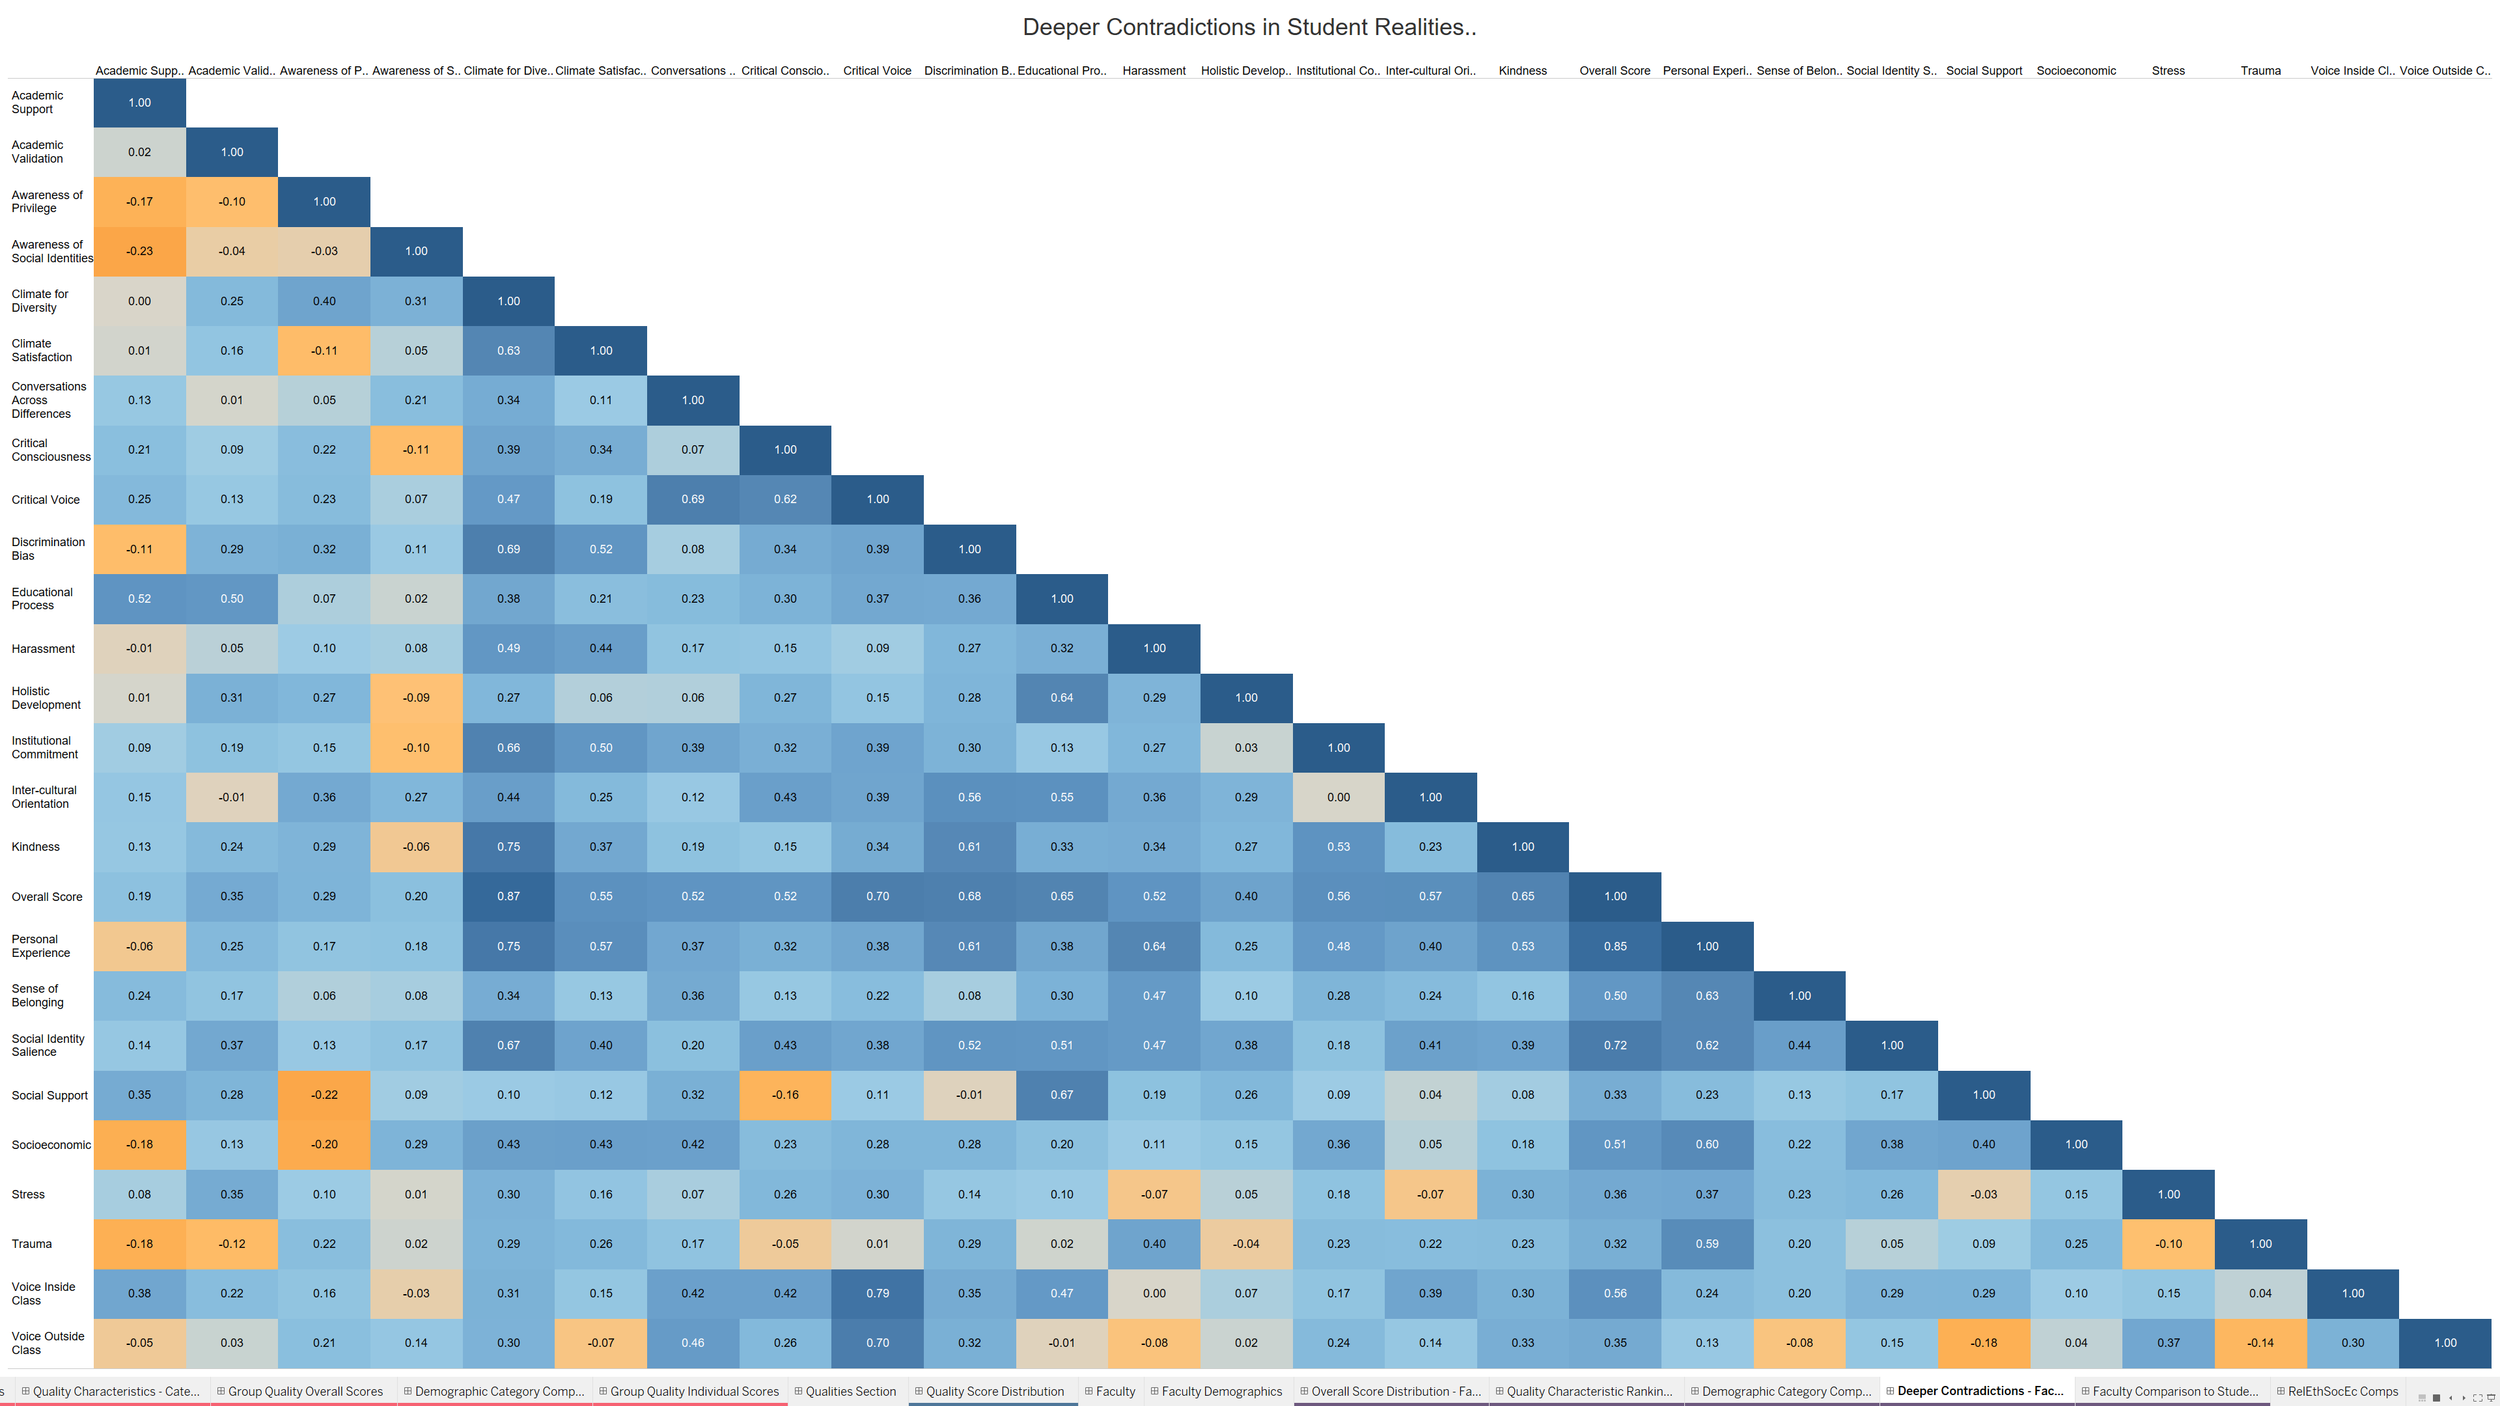
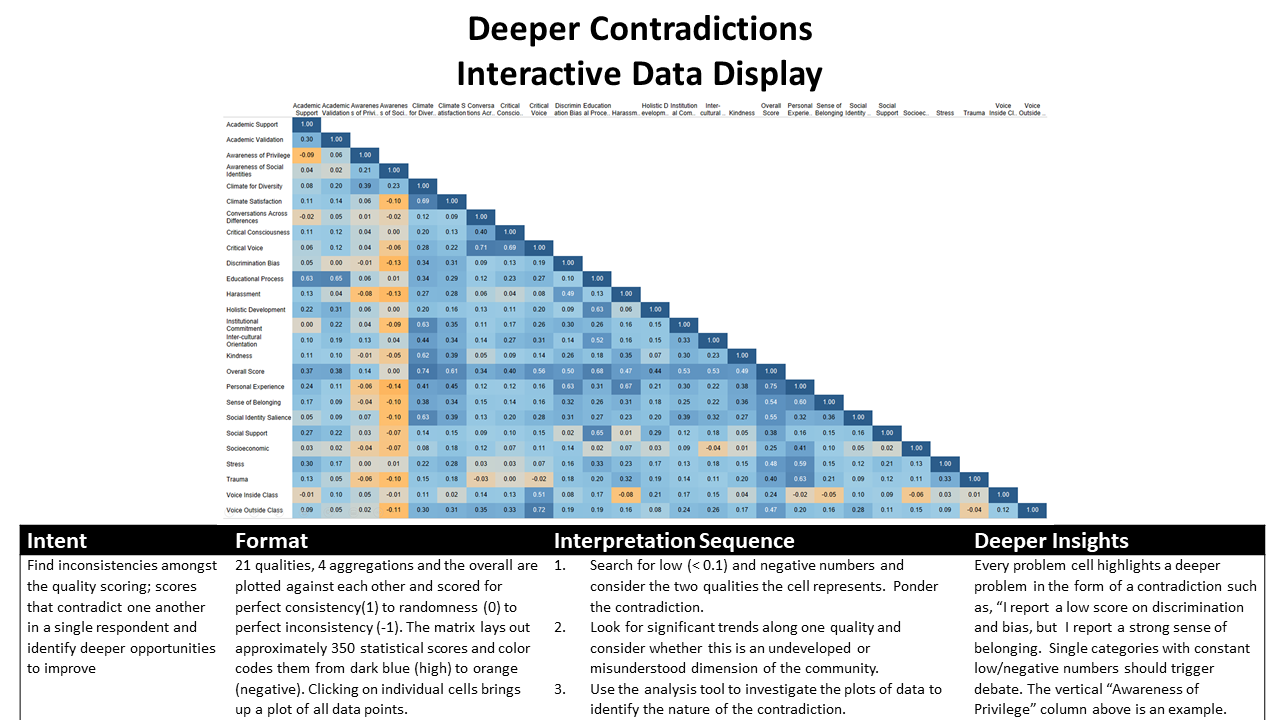
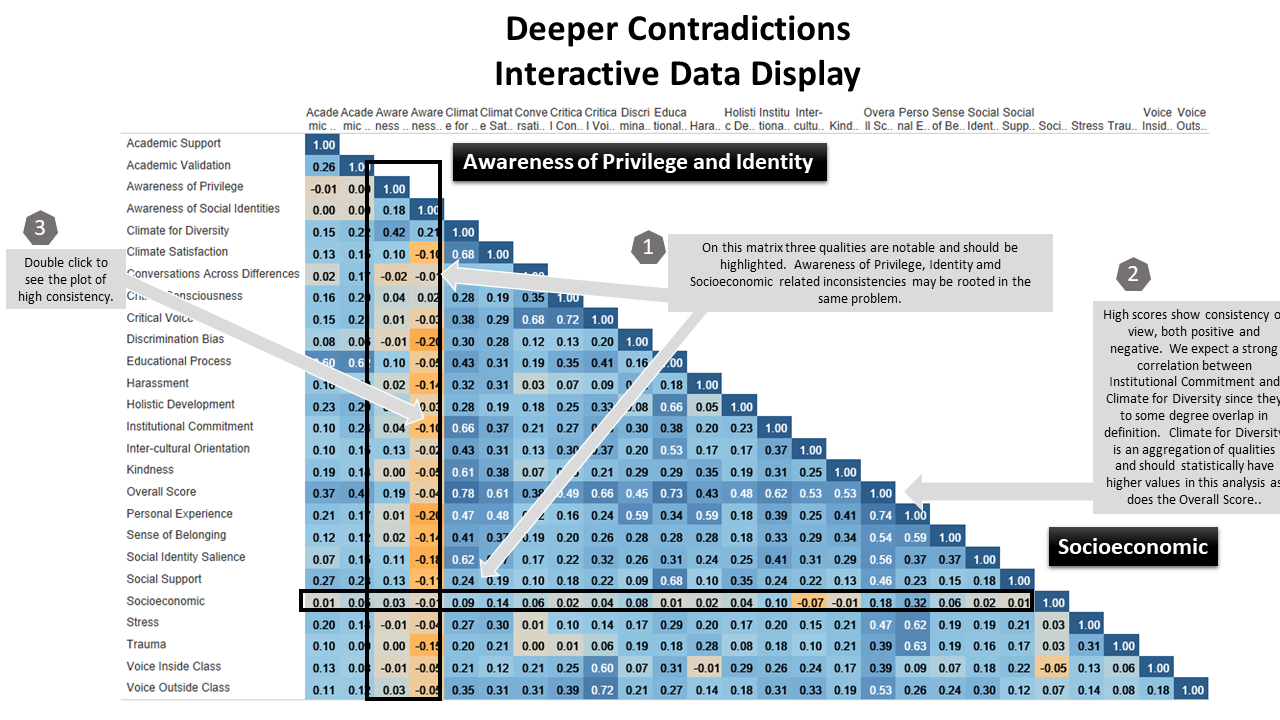
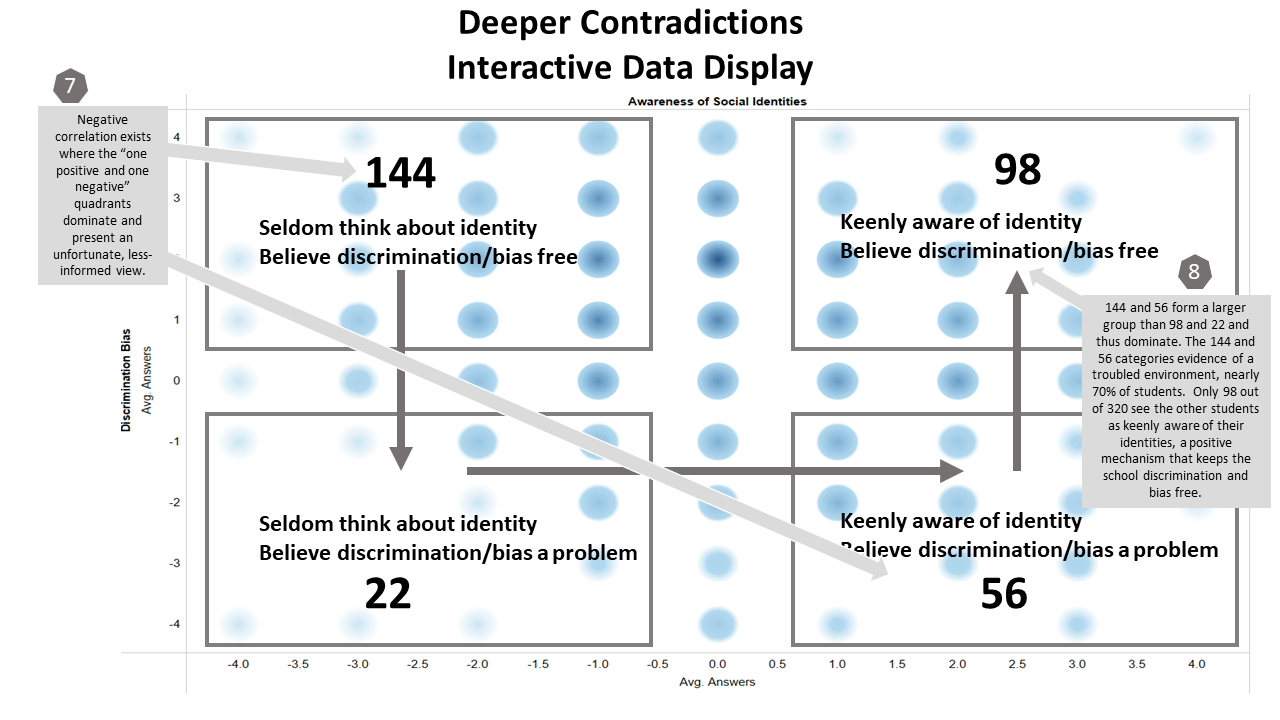
In the 21-quality survey, there are 210 paired quality relationships. The analytical package uses a tool called Deeper Contradictions to correlate the 210 relationships and produce a graphic that quantifies and color-codes the consistent or contrasting nature of each relationship. This allows us to both judge consistent pairs versus expectations, as well as find contradictory relationships.
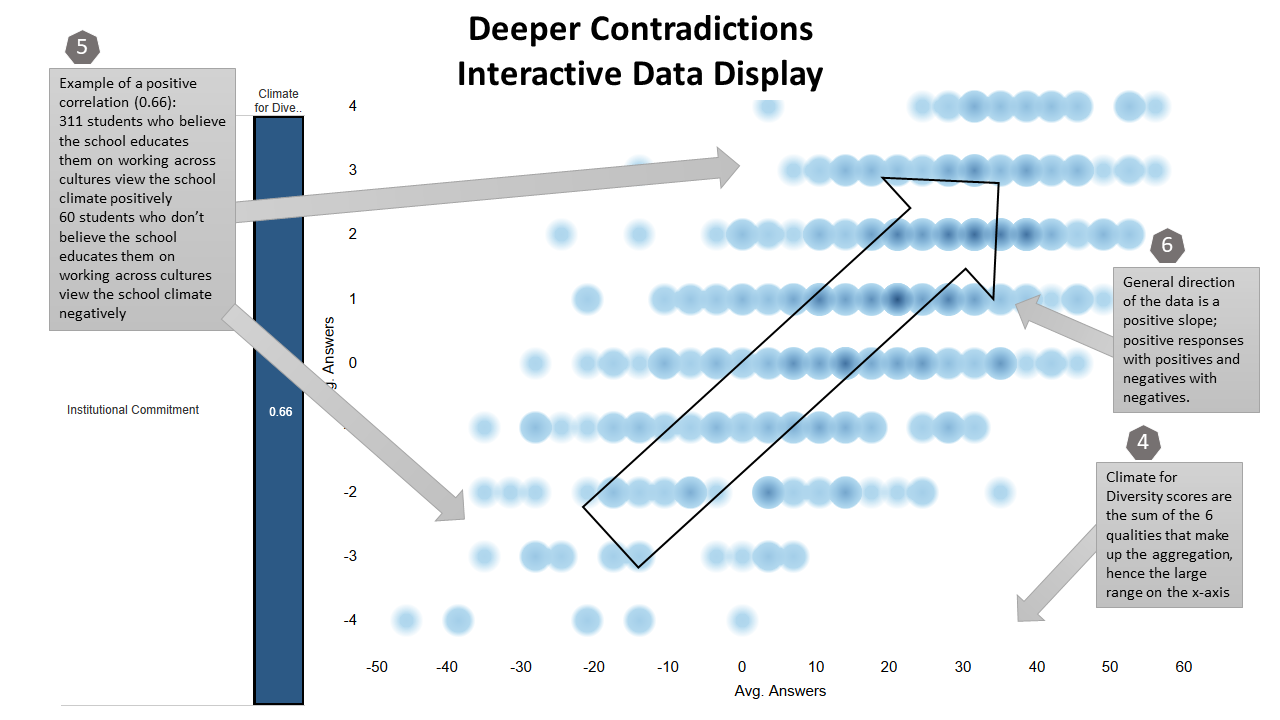
Since this is an advanced analytic and difficult to comprehend, the Deeper Contradictions tool provides a drill down that allows you to examine any pair of qualities by plotting all the student answers. This tool counts the students whose scores land in each of the four quadrants. This visual furthers understanding and helps interpret which of the two conflicting quadrants (Quality 1 Positive and Quality 2 Negative or vice versa) drives the “negative correlation” or in other words, the contradiction.
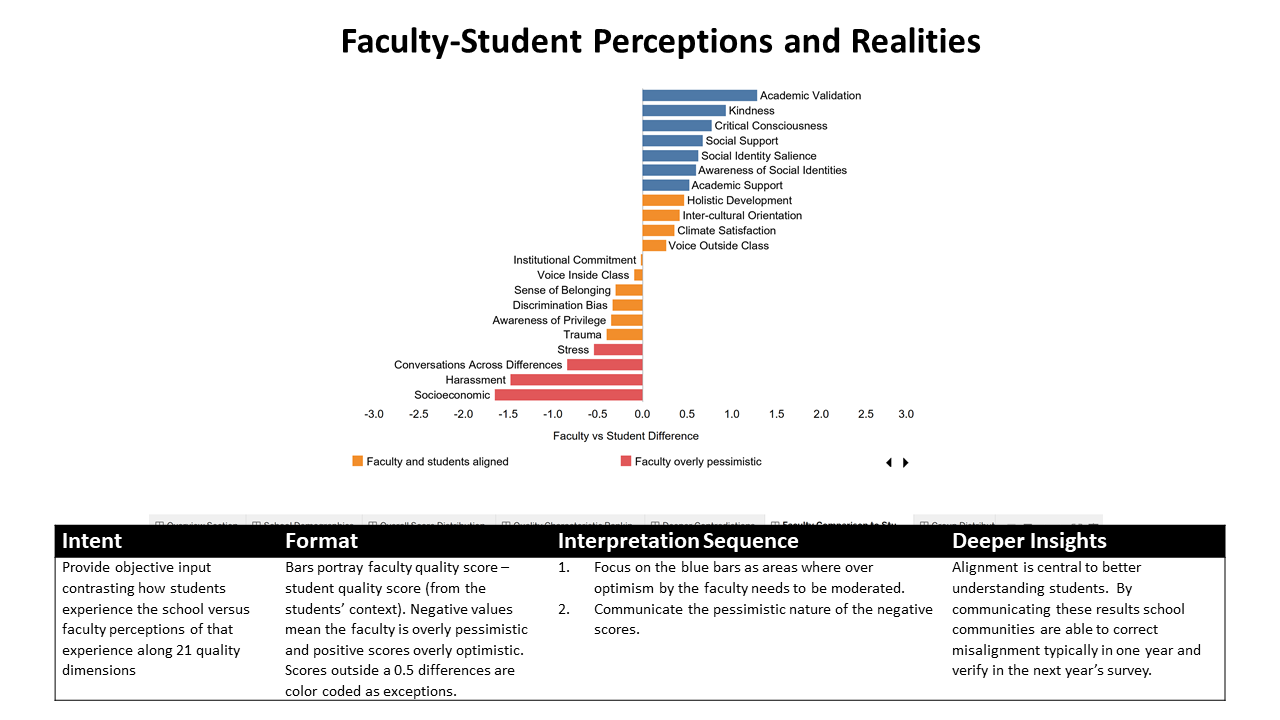
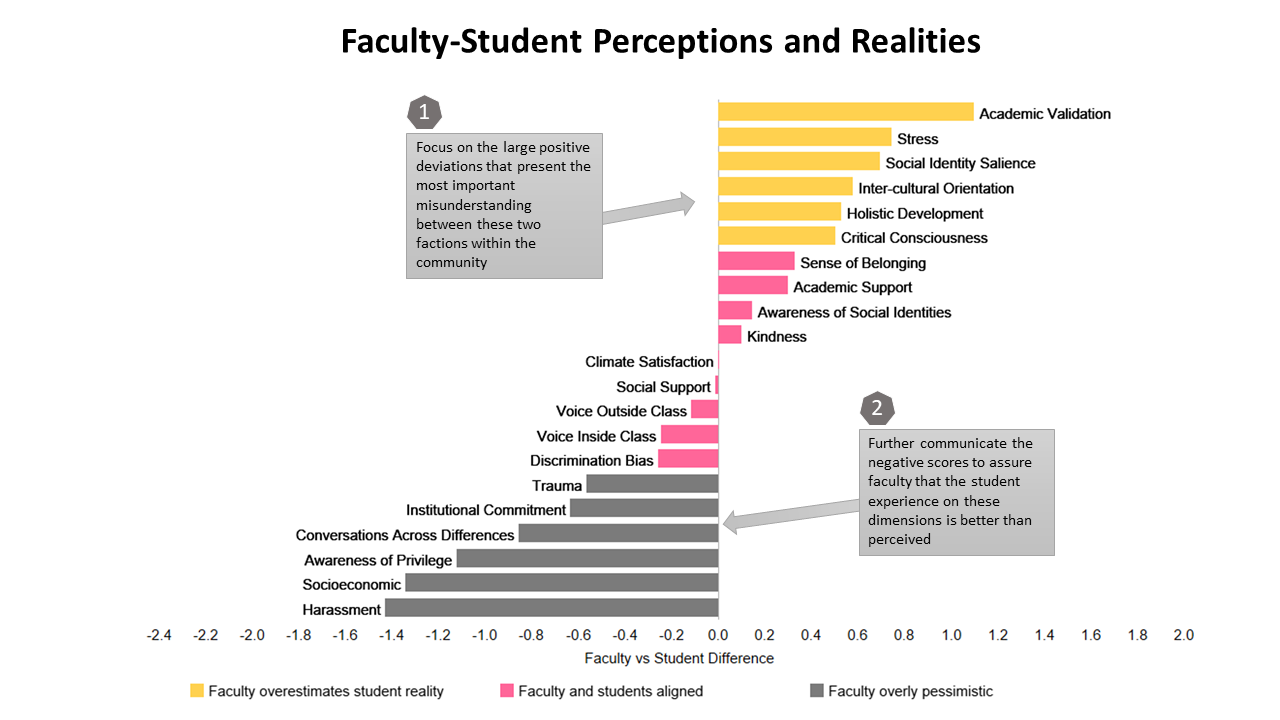
A related analysis of alignment focuses on the “faculty perceptions of the student experience” contrasted to the “student realities” defined by the student survey. To study these differences, the analytical tool plots the difference between the faculty and student scores for each quality. The results are sorted and placed in three tiers, qualities where faculty perceptions are overly pessimistic or optimistic and where they are aligned.

