Inclusivity Index Themes
Questions and Objectives
What is the complete range of experiences across the student body?
Greater than 50% highly satisfied
Less than 10% dissatisfied
What factors help explain both highly satisfied and dissatisfied groups?
Dissatisfied groups dispersed by size
Improvement in student experiences for dissatisfied and midrange groups, and participation of the highly satisfied in the process
The Experience Range portrays the collective student body’s view of the school community’s effectiveness, whether individuals feel valued and sense they belong, and if their education supports their holistic development. The entire histogram showing the number of students at each score level from approximately ± 40 communicates that there is no single experience, that students view the school at every point along the continuum, from strongly positive to deeply negative. Improving the community requires engagement with each faction, beginning with moving more students into the highly positive range, scores that indicate a substantive included experience. Equally, it points out the need to reduce the number of negatively scoring students which in the best of approaches, involves the most satisfied students in the process so that they too, learn and grow. Administrators use the data to understand the full scope of this challenge, and how many students fit into each category.
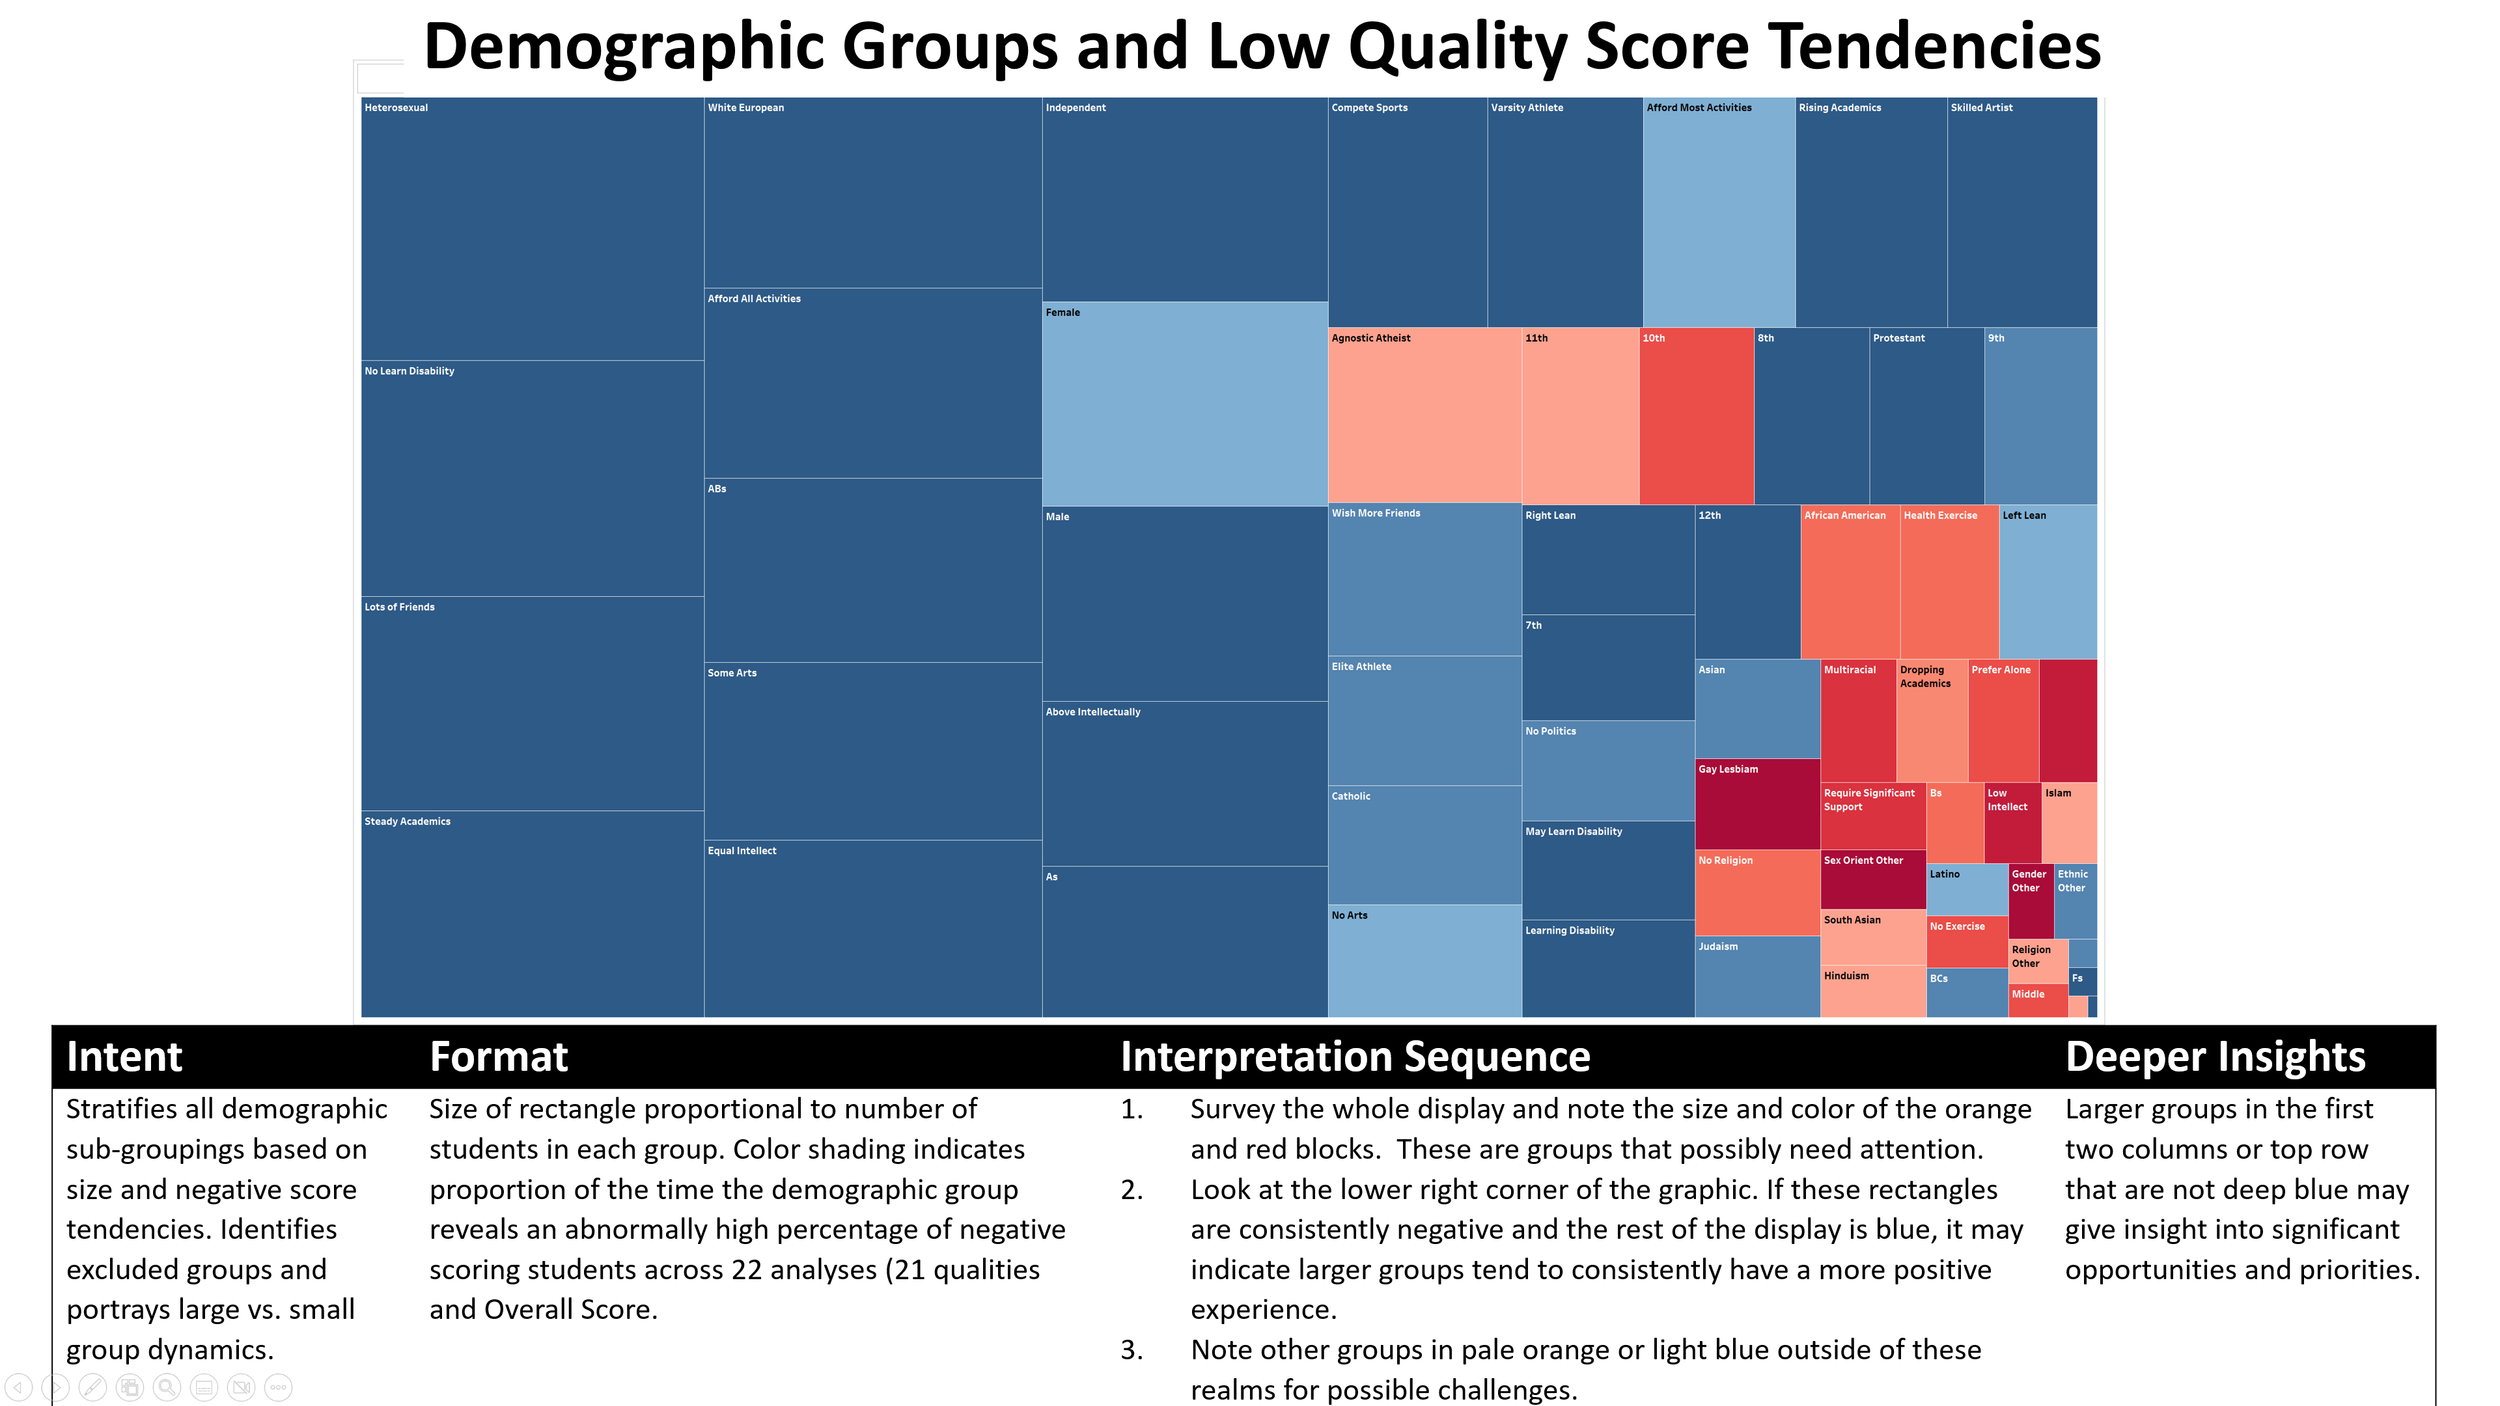
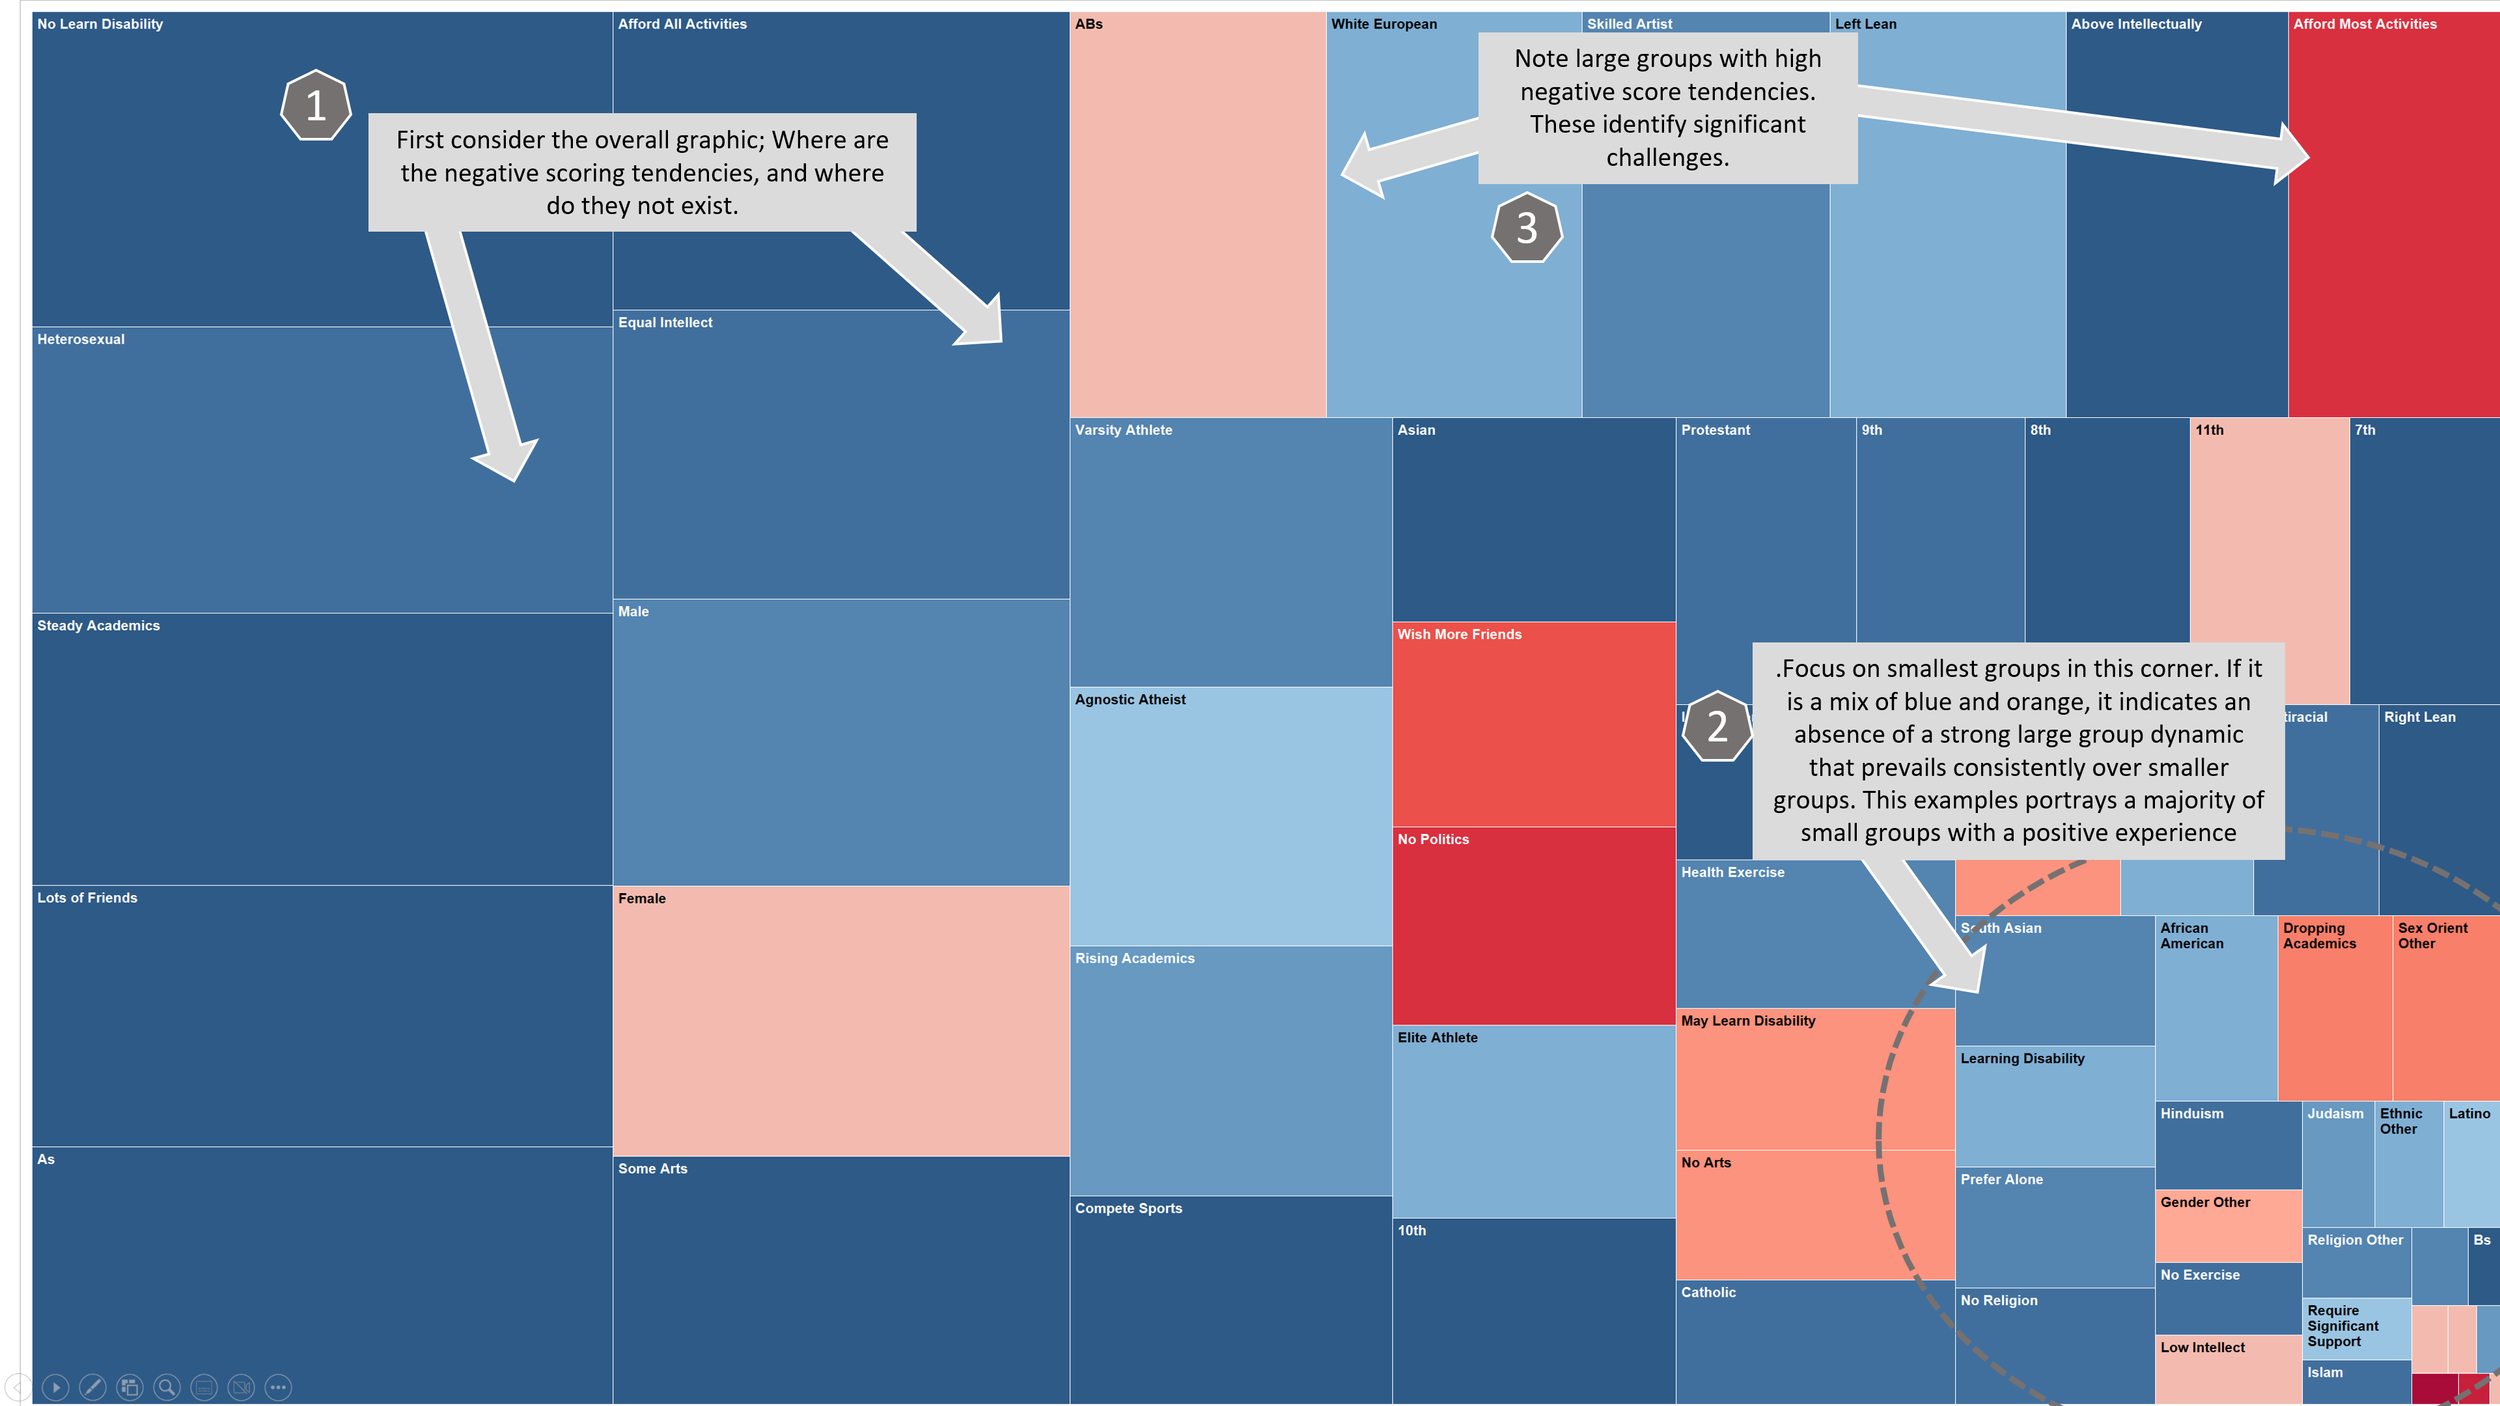
The second analysis focuses on finding common characteristics that define each part of the range, using identity and demographic subcategories. The graphics and supporting toolsets help administrators understand factors driving differences. The assessment includes a search for demographic subcategories with an unusually high percentage of students with negative scores across 22 parameters, the 21 qualities, and the Overall Score. The results are portrayed on a “Treemap” which sorts groups by size and uses color to code them according to their ratio of negative scores. The “Treemap” highlights particularly negative groups, and when viewed overall, tells whether the largest identities are more accepted and comfortable in the community. This informs administrators if associating with the largest groups ensures a more positive experience in contrast to subcategories with fewer students.
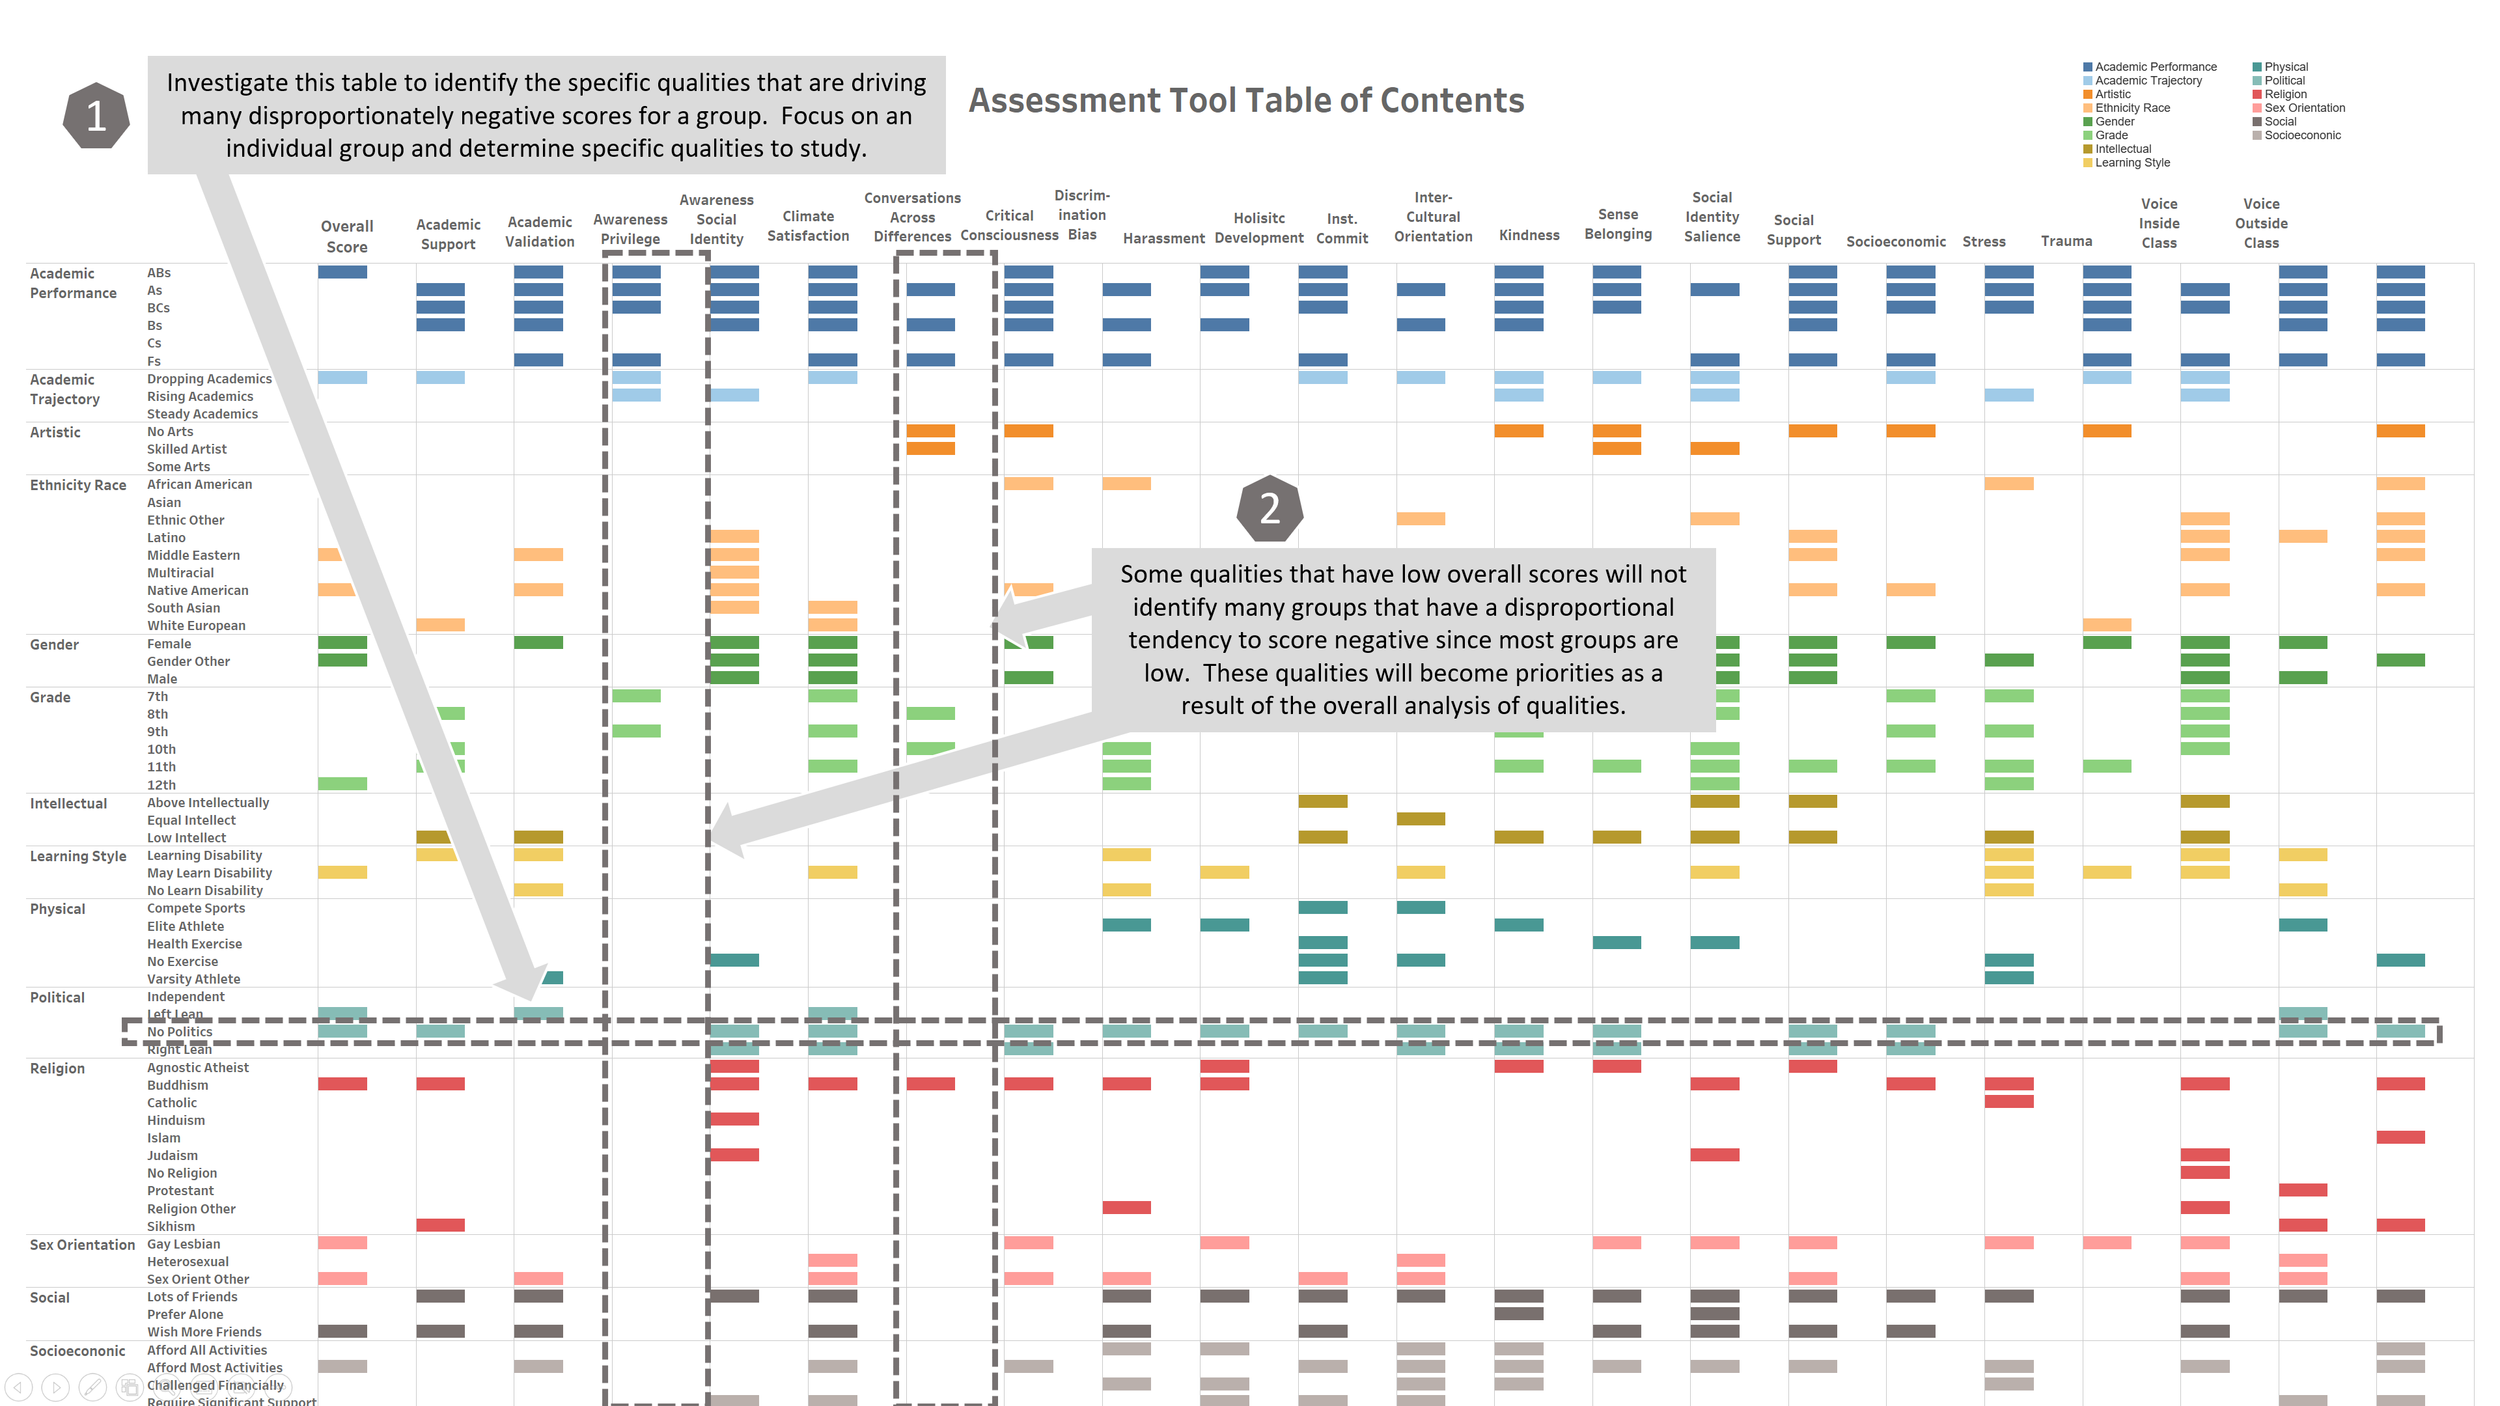
As you work through this analysis, you will become familiar with groups that stand out as being particularly negative. Tools allow you to further your understanding by ranking the 65 subgroups, independent of size, according to their “Negative Ratio.” An added “Table of Contents” provides a matrix of subcategories and qualities noting where significant negative scores were encountered.


