Understanding Faculty Contradictions in Views and Values
Can a K-4 school be a kind place if the students don’t enjoy productive play?
Do 7-12 schools care about their students academic success if they over stress and/or traumatize their students?
Do 4-8 schools teach their students to think if they fail to help them understand their identities?
The 12 to 21 qualities that make up the three grade level surveys of the Inclusivity Index are intended to cover a broad scope of student development while at the same time be supportive and consistent with each other. There are valid reasons for inconsistency as certain aspects of student development proceed more rapidly than others. In essence they get out of phase. The “Deeper Contradictions” analysis looks at the correlation between each of the qualities in both the student and the faculty surveys. When out of phase, it is logical that the correlations can weaken. However, once the relationships become negative, it raises questions as to whether the community believes in the relationship between the qualities. The “Deeper Contradictions” graphic analyzes this and presents between 150 and 300 correlation analyses in a single color-coded display. The color schemes inform both an overview and and individual quality relationships that should be considered. In the case of the faculty analysis, these negative correlations merit deeper discussion as the expectation for the faculty’s consistentcy in thinking and values is higher than that of the students.
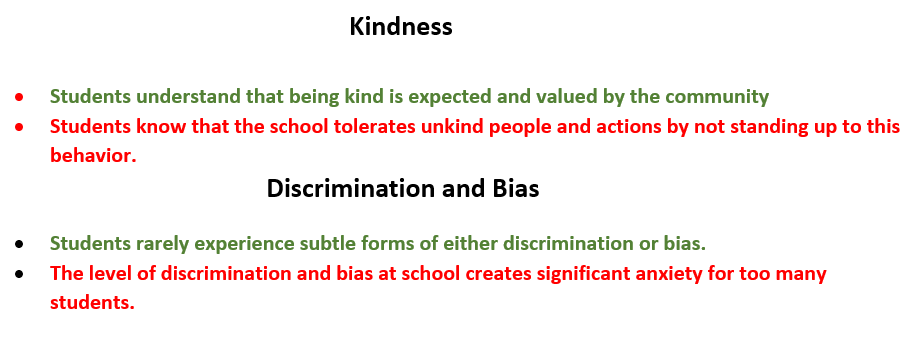
As an example, consider the relationship between Kindness and Discrimination and Bias. The faculty statements are:
A negative correlation between Kindness and Discrimination and Bias would mean that the statements “Students know that the school tolerates unkind people,” and “Students rarely experience subtle forms of either discrimination or bias,” are the prevailing choices in the survey (or it could be the opposite pair). If this contradiction is identified, it should stimulate significant dialogue among the faculty as to how these conditions coexist.
The nature of the faculty “Deeper Contradictions” output varies significantly between schools. The graphic shows six examples with the centerpiece slide illustrating a faculty with well-developed thoughts and a limited number of contradictions to discuss. The array of five other graphics show a full range of faculty scenarios. The graphic marked strong correlations offers many darker blue cells and a spattering of contradictions, the solid correlation one is a lighter blue, meaning slightly weaker correaltions among qualities although the same general characteristics. The middle of the upper five third shows concentrated contradictions and the fourth and the fifth show increasingly weaker correlations, with the bottom right being alarmingly inconsistent. Each scenario has ramifications for how the faculty should address the situation.
· Are contradictions as raised by this analysis at the faculty level important to address?
· Not all relationships between qualities are equally important. What is the process for identifying the more relevant relationships between qualities (the cells in the matrix) for your school?
· How should we react to concentrated negative correlations, especially if the rest of the analysis shows relatively strong relationships between qualities?
· What message does a particularly weak correlations analysis indicate about a faculty?


