Lower School Overall Score Influences
The Inclusivity Index uses a statistical model to determine the nature and magnitude of influences on the overall student experience and sense of the community. For Lower School students the All-Schools Database for the K – 4 survey provides an objective input into this discussion. The analysis looks at the Overall Score data and relates the distribution of scores to the six demographic categories gathered in the K-4 survey. It reveals which identities are most associated with students that score below average.
The initial statistical model considers each student’s self-described identities encompassing grade level, gender, ethnicity/race, religion, social approach, and socioeconomic level. This starting exercise determines which of these identities is statistically significant in predicting the group student in which a student likely resides. The second step Revised Final model then removes the insignificant demographics and quantifies the impact of the remaining significant identities.
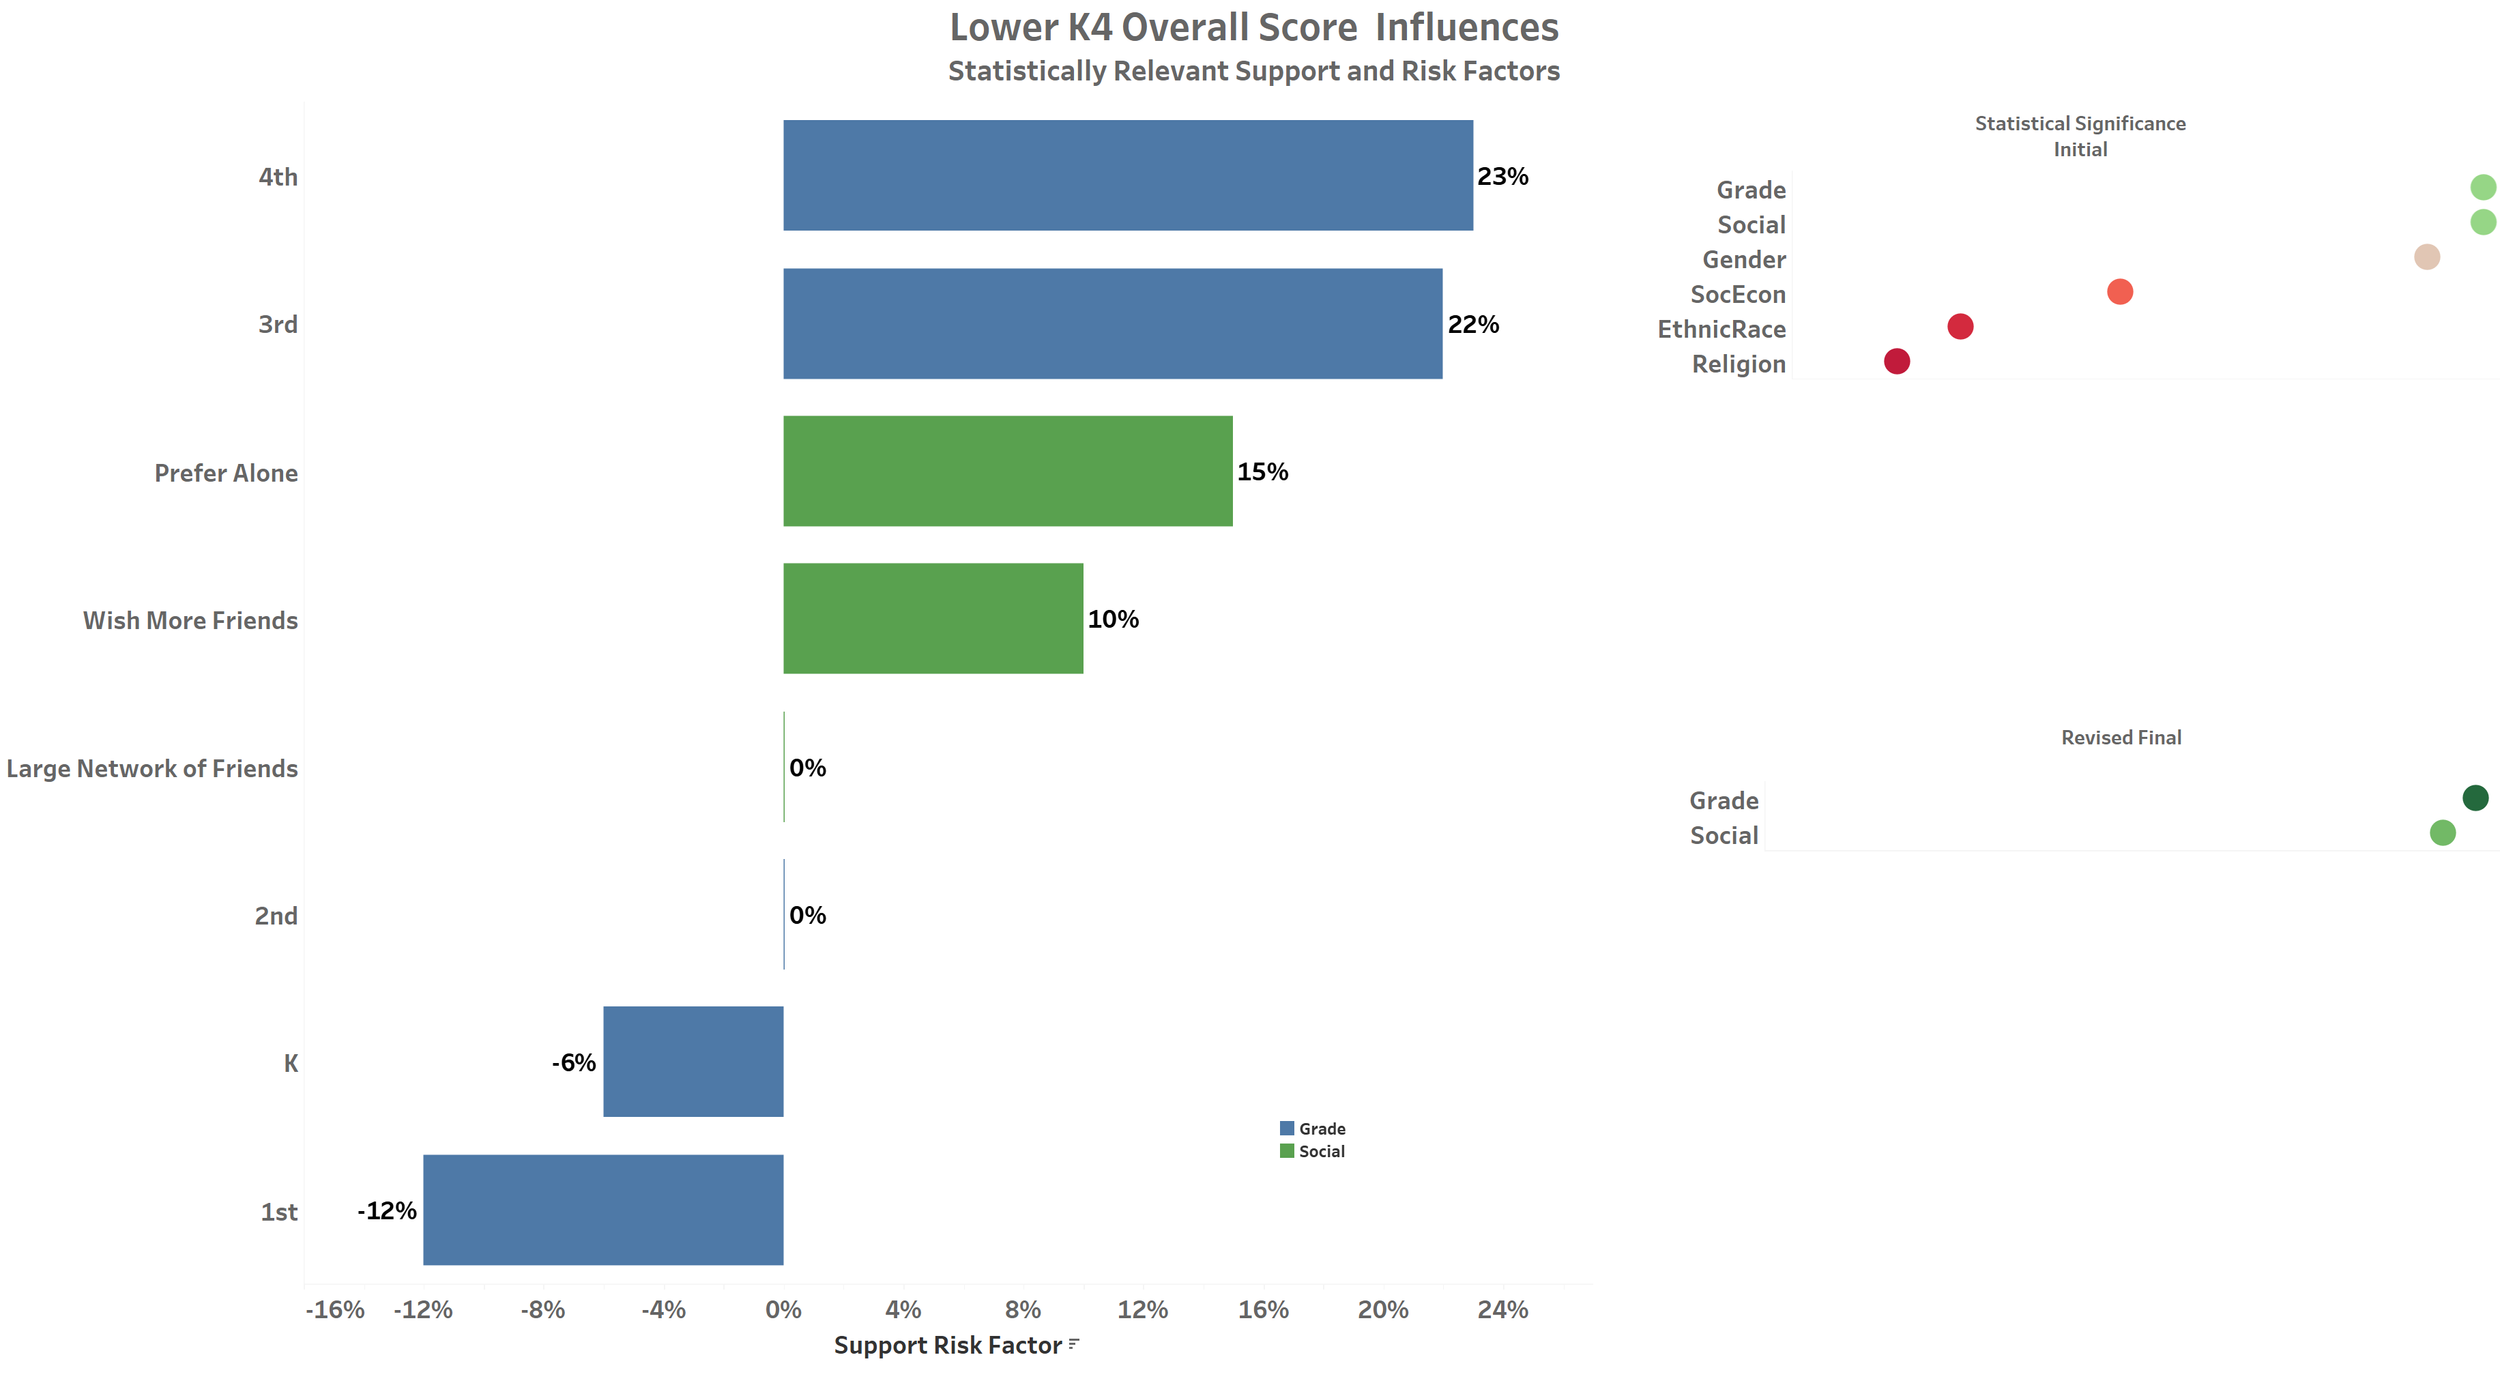
The graphic shows the results of this K – 4 Revised Final model analyses:
The upper right of the graphic arrays the identities based on their statistical significance with the left red dots indicating insignificance and the right green dots noting high significance. This shows that grade, social, and to a lesser degree, gender display some impact while socioeconomic, ethnicity/race and religion fall far below the significance threshold. Rebuilding the model with just these three identities teaches us that gender adds very little to the understanding and thus, we omit gender in the Revised Final model. Note that gender plays a larger role in the parallel analyses for Middle School and Upper School surveys.
The Revised Fina; model represents the risk of being in the lowest quartile of Overall Scores, the bottom 25%. It shows that the progression across the grade levels has the most pronounced impact on Overall Score. First-graders are the most likely to produce a positive score followed by kindergartners, while third and fourth graders have between a 20 and 25% higher probability of reporting a low Overall Score. Additionally, students identifying as Prefer to be Alone show an additional 15% probability of low scores while Wish for More Friends carry a 10% higher risk low scores.
· Is there significance that Gender falls slightly below the statistical significance threshold?
· How should we think about the three demographic categories that show little evidence of influence in the statistical modeling?
· Is the magnitude of the change across the grade levels relevant?
· Does this impact thinking on the role of a student’s “socialization approach and development” in the Lower School years?

